Never Locked Out: Monitoring SSH Reachability with Uptime Kuma and Tailscale
Introduction
This is a small, focused application of Uptime Kuma. Out of the many things you can monitor with it, a TCP port check is one of the simplest. I use it to watch port 22 on every machine in my Tailscale tailnet, so I find out about a broken SSH path before I’m trying to fix something else and discover I’m locked out.
If you haven’t set up Uptime Kuma yet, we have a dedicated article on installing it.
Why Monitor SSH?
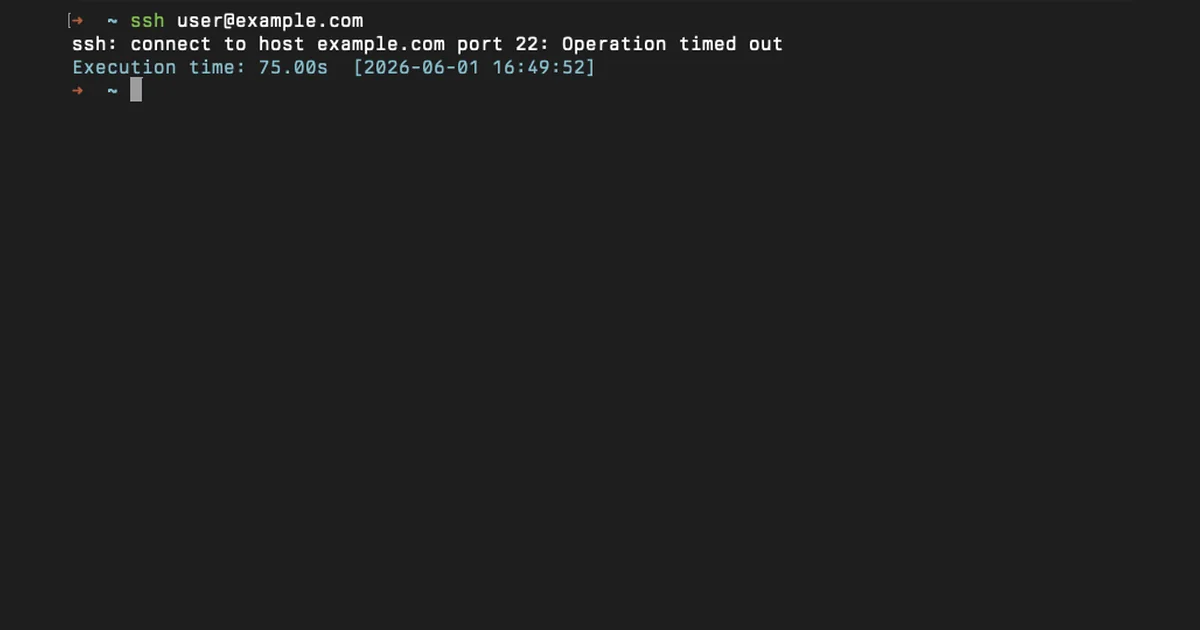
SSH is the entry point to remote machines. This door rarely fails loudly. sshd can crash after an upgrade, a kernel update may need a reboot you forgot to do, a host firewall rule can quietly start dropping inbound 22, or a careless edit to sshd_config might lock out your user with no one noticing. In every case, the box keeps running. You only realise the door is shut when you next try to walk through it, which is usually the moment you actually need it.
A passive check every minute or two costs next to nothing and transforms “that machine won’t let me in” into a notification that arrives hours sooner.
Note that this covers the necessity of monitoring. By itself, it will not do much unless you have a fallback mechanism for regaining access to your machine(s). We talk about it in this section.
Prerequisites
- A working Uptime Kuma instance with at least one notification channel configured.
- Tailscale installed on the machines you want to monitor, with MagicDNS enabled.
- The Uptime Kuma host on the same tailnet, so it can resolve MagicDNS names and reach the other machines over the WireGuard mesh.
sshdlistening on port 22 on each target machine. If you’ve moved SSH to a different port, substitute that everywhere below.
Verification
Before adding monitors, confirm the Uptime Kuma host can actually reach each machine over Tailscale. Run these from the host that runs Uptime Kuma.
Check that Tailscale is up:
1tailscale status
You should see a list of peers in your tailnet with their MagicDNS short names in the first column.
Resolve a MagicDNS short name to a 100.x.y.z Tailscale address:
1tailscale ip gandalf
Replace gandalf with one of your machine names. Expected output:
Confirm port 22 actually answers from this host:
1nc -zv gandalf 22
Expected output:
1Connection to gandalf (100.64.0.12) 22 port [tcp/ssh] succeeded!
If any of those fail, fix the Tailscale side first. Uptime Kuma will see exactly what your shell sees.
Add a TCP Port Monitor
In the Uptime Kuma dashboard, click Add New Monitor. Set Monitor Type to TCP Port.
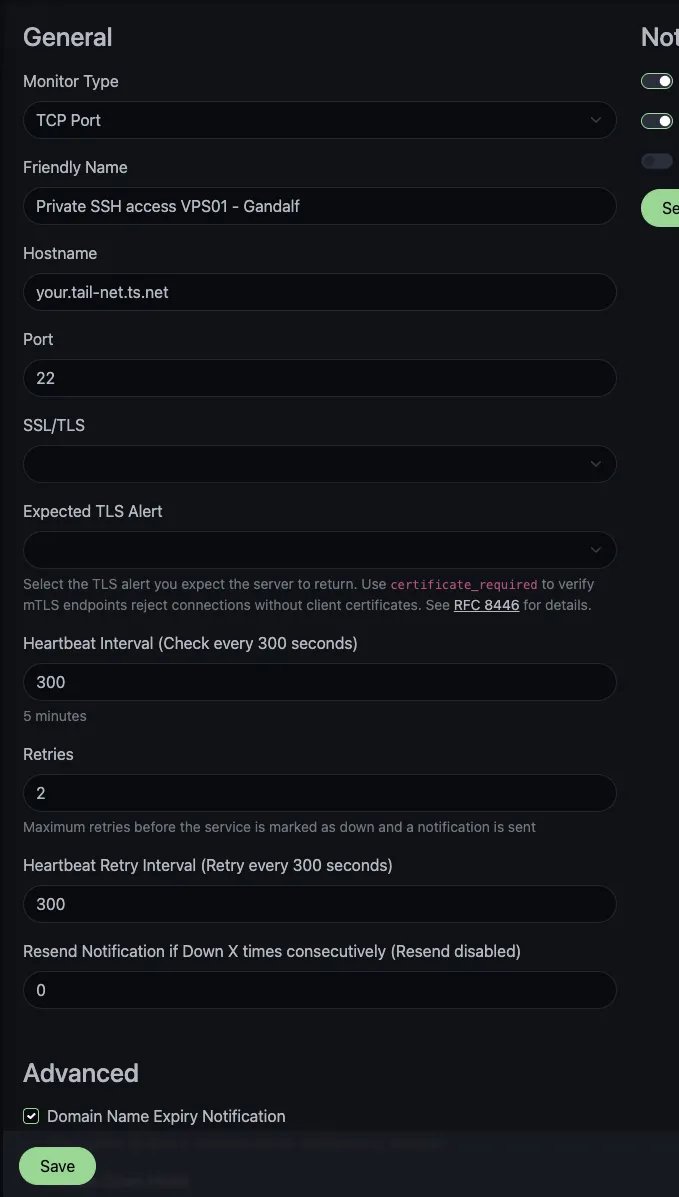
Fill in the form:
- Friendly Name: something like
SSH: gandalf. When you have a dozen machines, prefixing withSSH:lets you filter the dashboard at a glance. For further organisation, you can create groups of monitors in Uptime Kuma as well. - Hostname: the MagicDNS short name (
gandalf) or the Fully Qualified Domain Name (FQDN):gandalf.tailnet-name.ts.net. Tailscale will resolve either over the tailnet. I personally use the FQDN. - Port:
22for SSH. - Heartbeat Interval:
300seconds (five minutes) is a sensible default for SSH. It’s fast enough to find out before you need the box, slow enough to keepsshdlogs quiet. Drop to60for snappier alerts on a fast-moving network. - Retries:
2is plenty. - Heartbeat Retry Interval:
300seconds. Matches the heartbeat interval. Two unsuccessful retries before alerting will manage minor, temporary issues without unnecessary warnings. - Notifications: attach whichever channel you’ve configured (email, ntfy, Discord, Telegram, and so on).
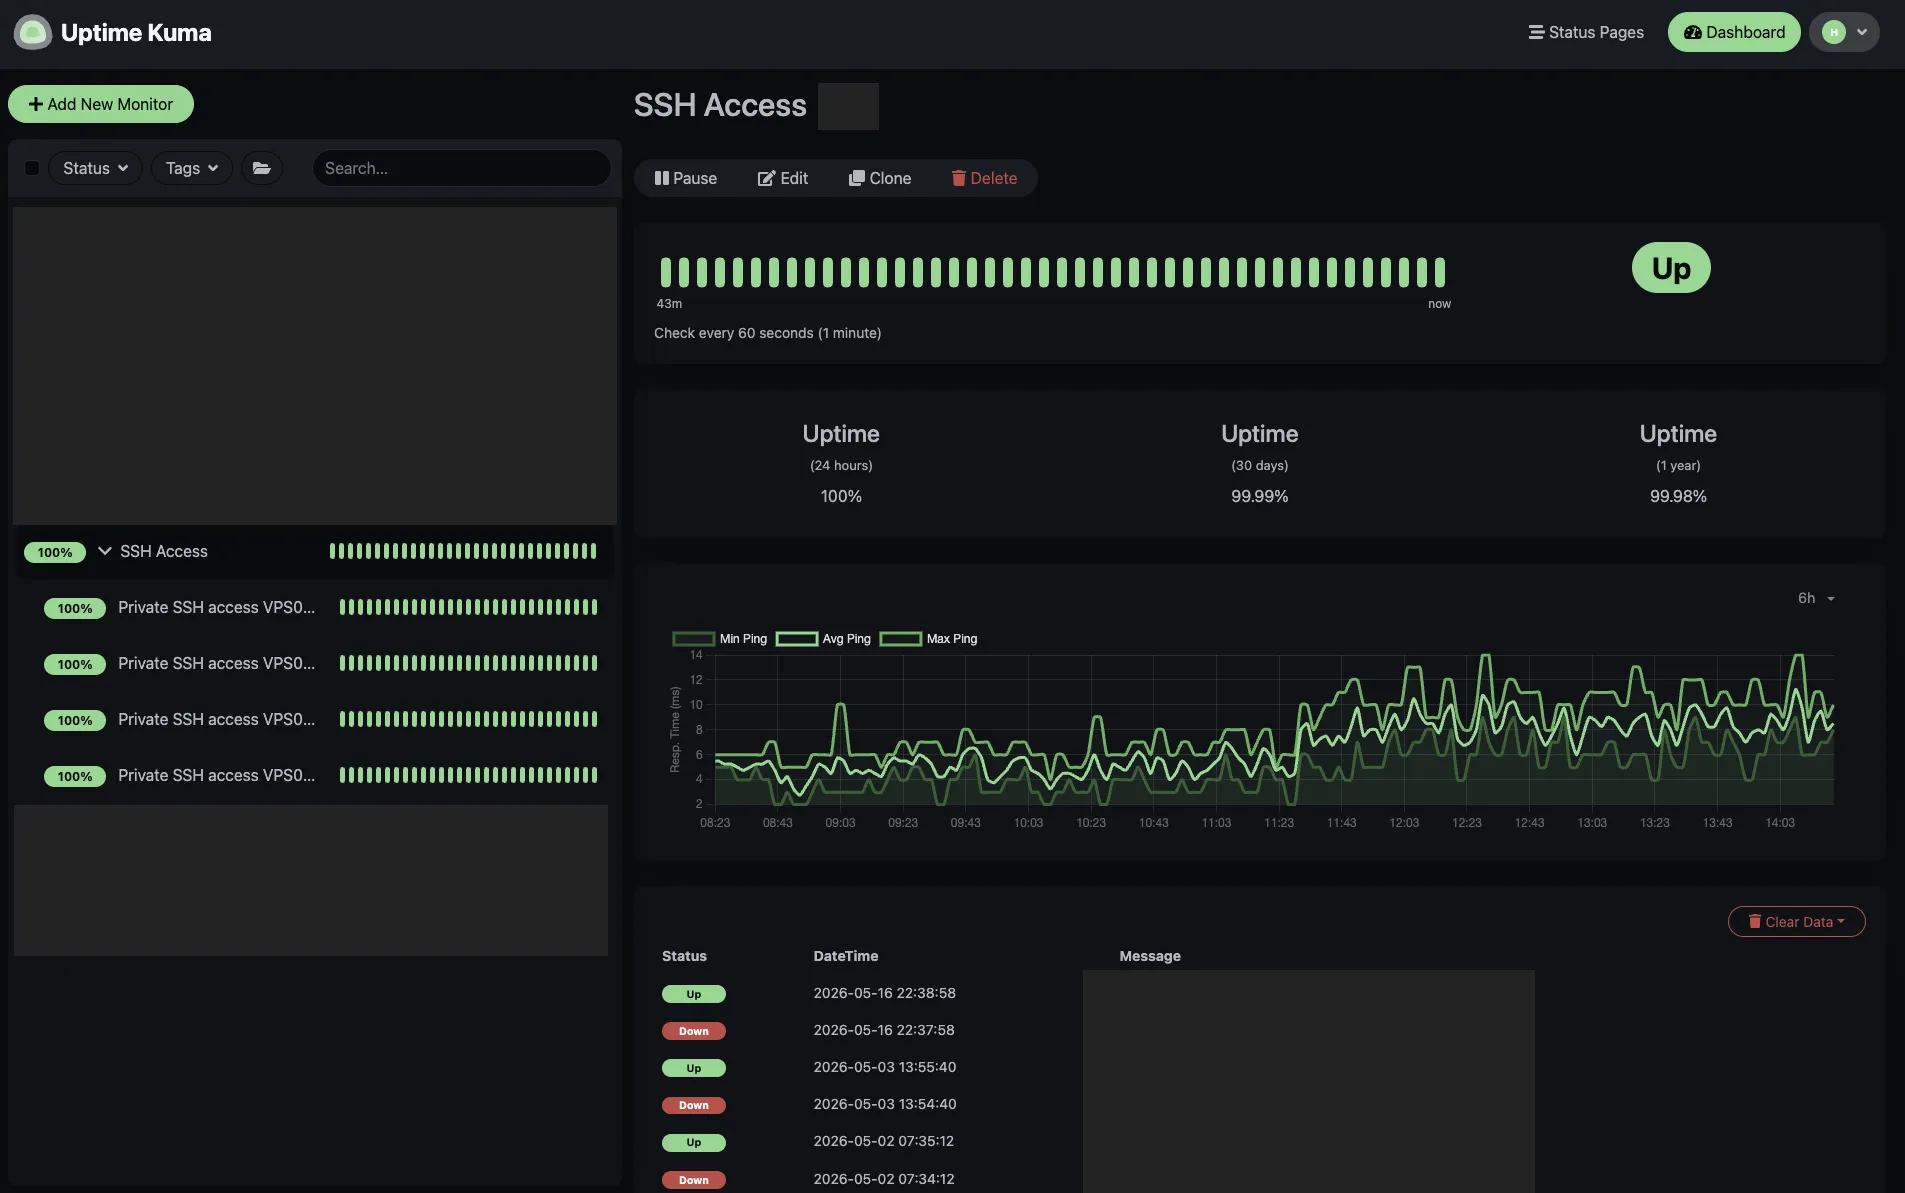
Save it, then repeat for every machine you care about. To save time, clone the first and change the hostname for the rest. A dashboard with one tile per machine takes minutes to set up and pays for itself the first time something quietly breaks.
Going Further: Catching Accidental Public Exposure
Let us now consider the inverse problem. The setup above tells you when SSH stops working over the tailnet. It doesn’t tell you when SSH works from somewhere it shouldn’t. If a host firewall rule lapses, or sshd ends up bound to a public interface after a careless config edit, your tailnet-only assumption breaks silently.
A second Uptime Kuma instance running outside your tailnet (say, on a small VPS or a friend’s home server) can catch this. Add a TCP Port monitor for the public hostname or IP of each machine on port 22, and turn on Uptime Kuma’s Upside Down Mode. With that toggled, “reachable” registers as DOWN. The notification fires when SSH is unexpectedly reachable from the public internet.
Note: I haven’t deployed this myself. The boxes are firewalled at the cloud-provider level, and I’ve trusted that single layer. If you do set it up, the wiring is the same shape as a normal TCP monitor. There’s a toggle to flip the monitoring to alert if something’s up instead of down.
There are other alternative approaches available. Upside Down mode on Uptime Kuma is pragmatic because we’re already self-hosting Uptime Kuma and we don’t want another tool to maintain.
Fallback Paths Before You Need Them
Monitoring alerts you to a failure. The actual fix needs to be administered through fallback paths. The belt and braces approach means one supports the other; they aren’t interchangeable.
Confirm that the out-of-band console from your provider works on VPS-hosted machines prior to losing SSH access. Hetzner Cloud’s Rescue System or the console, Akamai Linode’s Lish, and DigitalOcean’s Recovery Console all let you in over the provider’s own channel when the network path is broken. The equivalents on AWS, OCI, and Vultr work the same way. Boot one of your droplets into rescue mode now, log in once, and bookmark/save the page.
For machines I can physically touch, the fallback is dumber and more reliable: a USB keyboard, a working HDMI cable, and a display I’ve tested. I do this check before installing Tailscale on any machine I bring online, so I know I can recover the box even when the network is broken.
The full stack ends up being: Tailscale to reach the box, an Uptime Kuma monitor to tell me when that stops working, and an out-of-band path for the day both layers fail at once.
Conclusion
A simple TCP port monitor on port 22 over Tailscale’s Magic DNS is a very small but very powerful application of Uptime Kuma. This automation has saved me from guessing “when did this particular machine go down?” You can apply this same technique for any TCP service that you want to keep an eye on inside your tailnet. It can be a Redis instance, a Postgres database, a Minecraft server, or anything that listens on a port.
How do you keep yourself from getting locked out of your own machines? Share it in a comment below!
Comments