Uptime Kuma: Self-Hosted Monitoring Tool
Introduction
Uptime Kuma is a self-hosted monitoring tool. You point it at your services, and it checks whether they’re up. It can check via HTTP, TCP, DNS, ping, or push. If something goes down, it sends you a notification through whichever channel you prefer: email, Discord, Telegram, Slack, ntfy, and many others.
The project is created by Louis Lam and is available on GitHub under the MIT licence. The latest release at the time of writing is v2.3.0, published on 1 May 2026.
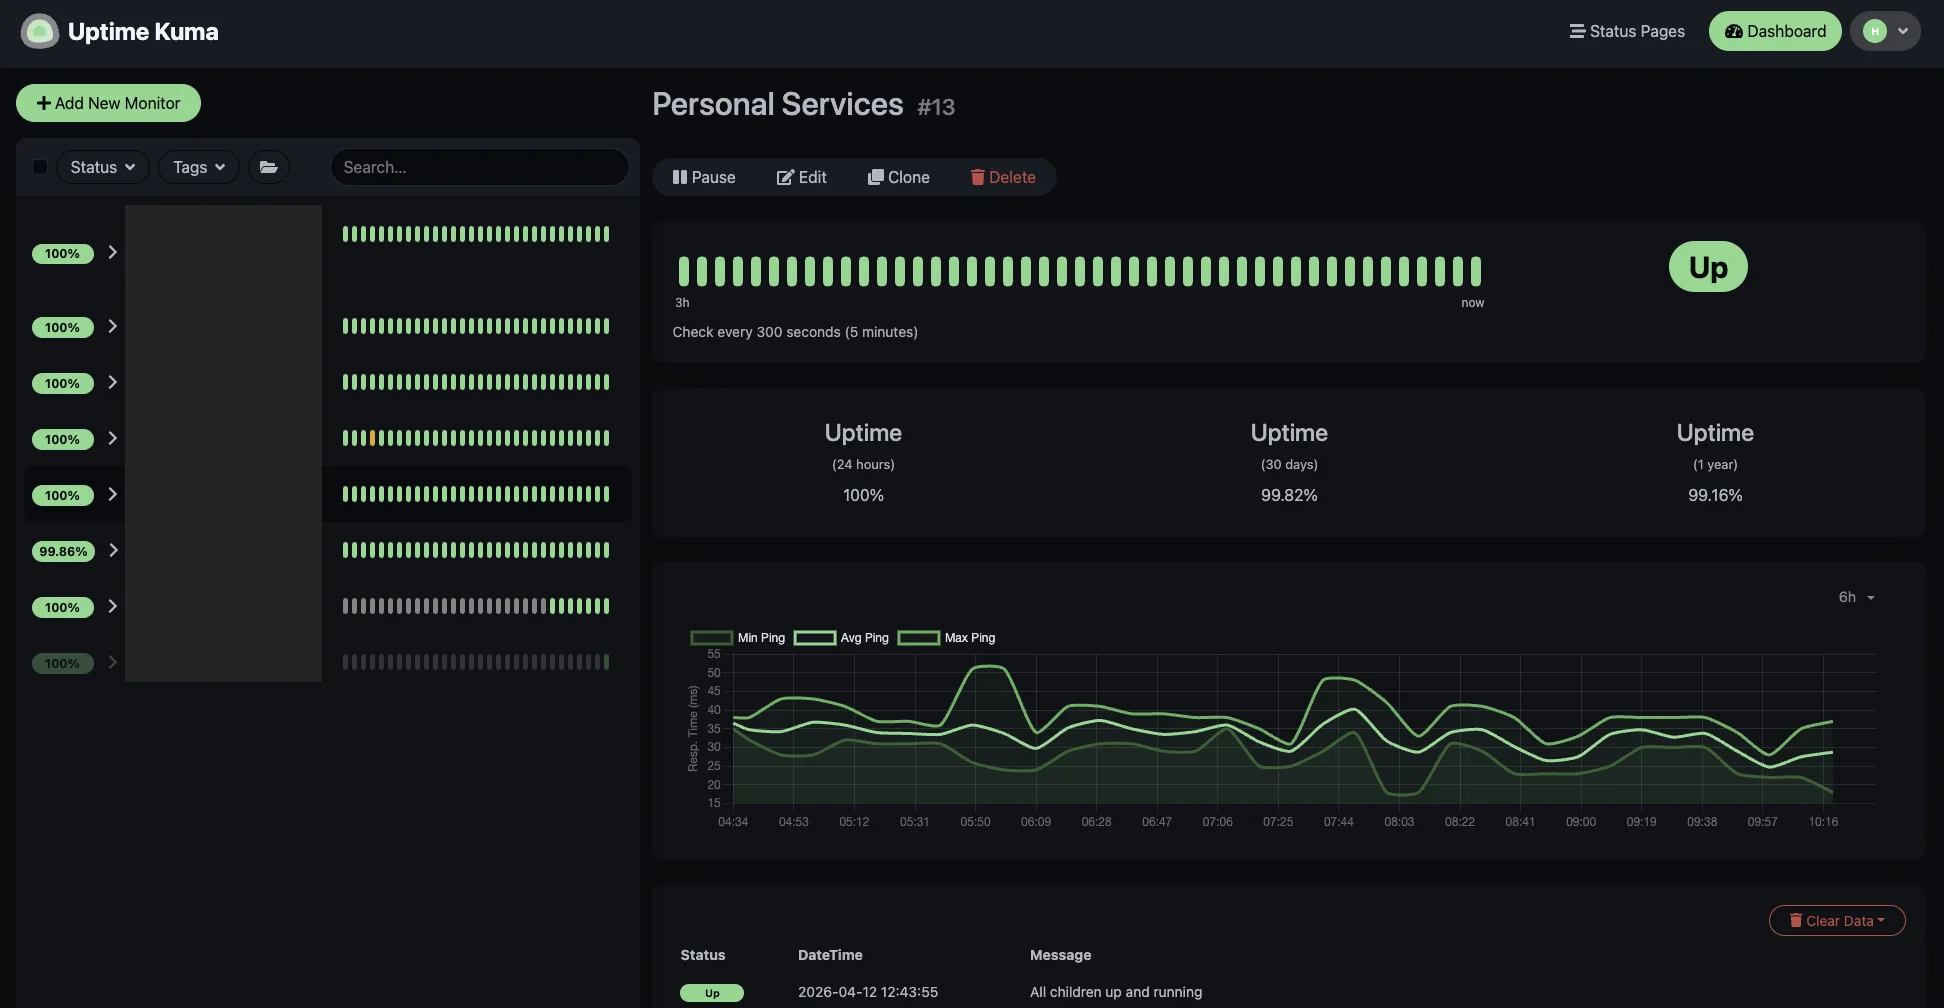
If you run any self-hosted services, you probably want to know when they go down before your users do. Uptime Kuma handles that with a clean dashboard and a deployment that takes five minutes or fewer.
Prerequisites
- Docker version 20.10 or later with the Compose plugin.
- A Linux server (Debian or Ubuntu recommended) or any system capable of running Docker containers.
- An optional reverse proxy if you want to expose it securely (e.g., Caddy, Traefik, or Nginx).
Verification
Before proceeding with the installation, verify that Docker is installed.
1docker --version
You should see output similar to:
1Docker version 29.0.1, build eedd9698e9
Verify Docker Compose is installed:
1docker compose version
Expected output:
1Docker Compose version 2.40.3
Installation
Choose or create an appropriate directory, such as ~/apps/uptimekuma. Some folks prefer the /opt/docker/<appname> pattern.
Create a docker-compose.yaml file:
 1services:
 2  uptimekuma:
 3    container_name: uptimekuma
 4    image: docker.io/louislam/uptime-kuma:2
 5    restart: unless-stopped
 6    networks:
 7      - caddy-network
 8    ports:
 9      - "3001:3001"
10    volumes:
11      - ./data:/app/data
12      # Uncomment to enable the Docker Container monitor type.
13      # - /var/run/docker.sock:/var/run/docker.sock:ro
14    logging:
15      driver: "json-file"
16      options:
17        max-size: "1m"
18        max-file: "1"
19
20networks:
21  caddy-network:
22    external: true
Note: The default port is 3001. Change the port mapping if that’s already in use on your server. If you’re using a reverse proxy like Caddy, you can remove the
portssection entirely and route traffic through the Docker network instead.
Pull the image and start the container:
1docker compose pull && docker compose up -d
Access Uptime Kuma at http://localhost:3001 (or your configured address). On first launch, you’ll be asked to create an admin account.
HTTPS
On a Private Tailscale Network
If you want free HTTPS without configuring certificates manually, you can use Tailscale Serve. After installing Tailscale on your server:
1tailscale serve --bg --https=3001 localhost:3001
This exposes your Uptime Kuma instance over HTTPS on your Tailscale network. Omit the external caddy network if you do not plan to expose it publicly behind a reverse proxy like Caddy.
On the Public Internet With Caddy
If you want to access Uptime Kuma publicly, use HTTPS. You can achieve this with a reverse proxy like Caddy, especially if you have it configured with the rate-limit plugin.
The docker-compose.yaml above already includes a caddy-network for this purpose. Point your Caddy configuration at the uptimekuma container on port 3001.
Monitor Types
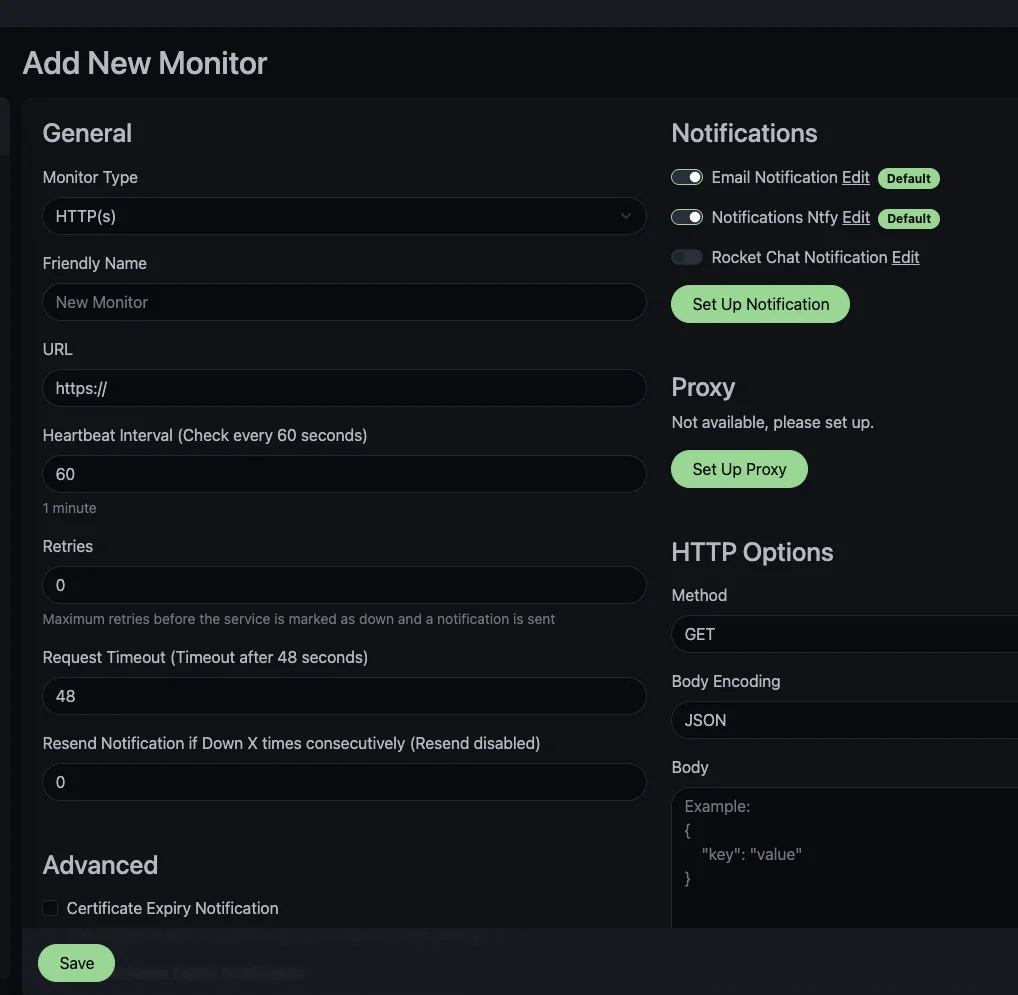
When you click Add New Monitor, the default type is HTTP(s). It sends a GET request to a URL and checks the response code.
Uptime Kuma supports several other monitor types:
- HTTP(s): checks a URL for a specific status code or keyword in the response body.
- TCP: connects to a host and port. Useful for databases, mail servers, or anything that listens on a port. We use this to keep tabs on SSH across a Tailscale tailnet.
- Ping: ICMP ping to check whether a host is reachable.
- DNS: queries a DNS server and checks the result against an expected value.
- Push: the monitored service pushes a heartbeat to Uptime Kuma instead of the other way around. Useful for cron jobs and batch scripts. We use this for a dead man’s switch on weekly Docker Compose updates.
- Docker Container: monitors whether a specific container is running via the Docker socket.
- Steam Game Server: checks game server availability.
- MQTT: subscribes to an MQTT topic and watches for messages.
- And more! The full list of types is in the
server/monitor-types/directory in the source.
Each monitor can have its own check interval, retries, and notification settings.
Notifications
Uptime Kuma supports over 50 notification methods. You can configure multiple notification channels per monitor or set up default notifications that apply to all monitors.
To add a notification method, go to Settings > Notifications > Setup Notification (or click Set Up Notification when creating a monitor).
Here’s an example using SMTP email:
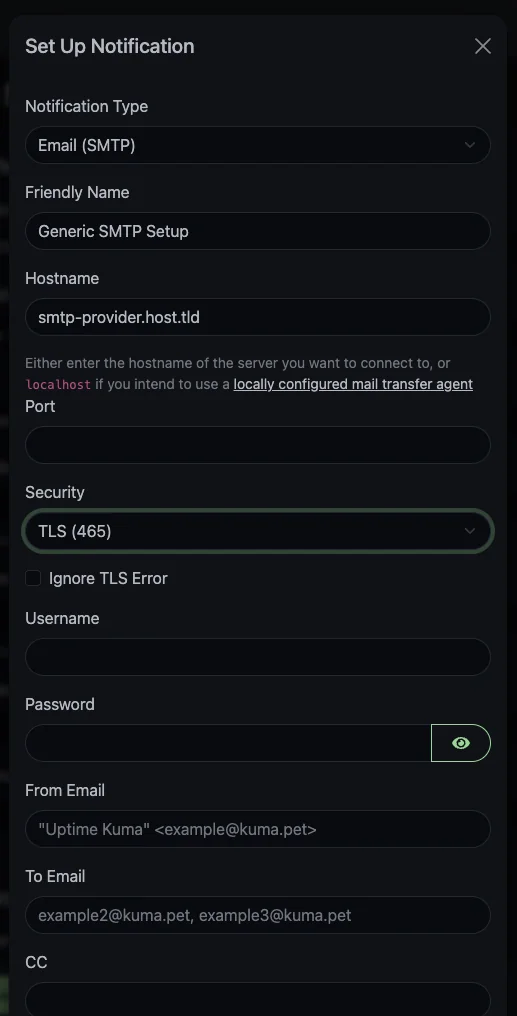
Fill in your SMTP server details (host, port, username, password) and the sender/recipient addresses. Click Test to send a test notification and confirm it works before saving.
Other popular options include Discord webhooks, Telegram bots, Slack incoming webhooks, ntfy, Apprise, Gotify, PagerDuty, and Pushover. The full list is visible in the notification type dropdown.
Status Pages
Uptime Kuma can generate public or internal status pages that show the current state of your monitors. This is useful if you want to share uptime information with users or a team without giving them access to the full dashboard.
You can create status pages from Status Pages in the top navigation bar. Each page gets its own URL and can include whichever monitors you choose.
One limitation: visitors can’t subscribe to status page updates. On services like Atlassian Statuspage, users can sign up for email or SMS alerts when something changes. Uptime Kuma doesn’t have this yet. It’s been requested several times but hasn’t been implemented. For now, notifications only go to channels configured by the admin, not to end users directly.
Open-Source Audit
Similar to what we did in our IT-Tools article, we checked what Uptime Kuma does on the server side. Each claim below links to a specific file in the repository at the v2.3.0 tag.
- Licence and authorship. Uptime Kuma is MIT-licensed. The primary maintainer is Louis Lam, with additional area maintainers. The latest release, v2.3.0, was published on 1 May 2026, and the project sees frequent merges from contributors.
- No outbound telemetry by default. The server-side code under
server/doesn’t phone home. We found no evidence of analytics SDKs,fetchcalls to external services, or tracking endpoints. - Update check is client-side only. The “new version available” banner is a client-side fetch against the GitHub Releases API. Your server doesn’t call out to check for updates. It’s just informational for whoever is viewing the dashboard.
- Push endpoint behaviour. The route handler for
/api/push/:pushTokenconfirms the URL format used by push monitors. The token in the URL is the only credential. No additional authentication is applied.
If any of this changed (say, telemetry was quietly introduced) the community would notice and fork. Same trust model as any open-source self-hosted tool.
Supporting the Project
If you get value out of Uptime Kuma, consider giving back:
- Sponsor Louis Lam on GitHub Sponsors.
- Contribute on GitHub: the project is written in Node.js and Vue.js. Bug reports, feature requests, and pull requests are welcome at the repository. Make sure to read the code of conduct and contributing guide before contributing.
- Help with translations: Uptime Kuma supports many languages and translation contributions are always appreciated.
Practical Applications
Congratulations on setting up Uptime Kuma! Now, what can you actually do with it? A few usages have earned their own articles on this site, with more on the way:
- Monitoring SSH reachability across a Tailscale tailnet: a TCP Port monitor on port 22 for every machine, with notes on upside-down monitoring for accidental public exposure, and on out-of-band fallback paths for the day Tailscale (or your local network) is the problem.
- A dead man’s switch for Docker Compose updates: a push-monitor pattern that triggers an alert when cron goes silent. Weekly
docker compose pull && docker compose up -dacross your stacks, with a single notification when something fails.
A few more applications we use ourselves but haven’t yet written up, each likely worth its own walk-through:
- Status pages for self-hosted services shared with family or a small group, despite the subscription limitation noted in the previous section.
- A “are my backups still running?” push monitor pointed at the success-tail of your backup script, with a heartbeat window matched to the backup cadence.
Let us know in the comments if any of these are worth reading, and we’ll prioritise them.
Conclusion
Uptime Kuma gives you a self-hosted monitoring dashboard with a five-minute Docker deployment. It covers the common monitoring patterns (HTTP, TCP, DNS, ping, push), has a wide range of notification integrations, and can generate status pages.
Have you set up Uptime Kuma or another monitoring tool? Share your experience in the comments.
Comments